Modelling with flying colours: the application of the RadGrad model to chromatic Hermann-grids
Mariann
F. Hudák
hudakmariann@gmail.com Institute of Psychology, Eötvös Loránd
University, Izabella u. 46,
H1064 Budapest, Hungary
János Geier janos@geier.hu Stereo Vision Ltd, Nádasdy Kálmán utca 34, H1048 Budapest, Hungary
Image and experimental software programmer: János Geier, HTML programmer: Mariann Hudák.
Extended abstract
It is known that illusory spots are chromatic in chromatic Hermann-grids. In some simple cases, their colour also has been described (e. g. Schiller and Carvey, 2005). For example, in Hermann grids with red squares and white streets spots are reddish, while in grids with green squares, spots are perceived greenish. In isoluminant grids, spots are scarcely perceived, or they are not seen at all.
So far, no model has accounted for the colour of spots in Hermann-grids comprising any arbitrary colour pairs. We present an overall theoretical model for the chromatic Hermann-grid illusion. Geier’s RadGrad model (Geier, et al, 2006) adequately predicts the presence of the spots in regular achromatic Hermann-grids, and also their absence in achromatic curved grids. The adequacy of the RadGrad model is supported by its computer simulation.
The basis of the RadGrad model is that an activity spreading starts from the edges. Towards the dark side of the edge, this activity spreading is inhibitory, while it is excitatory towards the direction of the light side of the edge. This entails that light areas will be perceived lighter and dark areas will be seen darker. The process is similar to the radiation of a radio antenna, but here the sources of the ‘radiation’ are the elementary segments of the edges in the image. The direction of the radiation is perpendicular to the edge segments. Therefore, the intersections of the regular Hermann grid will be out of the way of the radiation, leading to their relative darkening compared to the streets. In curved grids, however, the radiation easily gets into the intersections as well, since the edges are curved. Therefore the perpendicular direction of the spreading also touches the intersections.
For chromatic Hermann-grids, an additional principle is introduced to the RadGrad model: Hermann-grids are split into RGB channels, resulting in three separate images. The RadGrad simulation is run on each of them. Finally, the three outputs are rejoined into one, resulting in spots of definite colour in the intersections.
In order to compare the simulation results with perception, subjects (n=31) adjusted the colour of real spots placed in a Sinusoid grid, until they were the same colour as the illusory ones. The RGB code of the spot colours set by the subjects were stored by the computer program used in the experiment. Therefore, the results could statistically be compared with the simulation results of the model. The average of the R, G and B values were calculated in case of each colour pairs, and these averages were correlated with the R, G and B values of the spot colours set by the simulation. Result: the colour of the spots is aptly predicted by the model, since the correlation was higher than 0.9 in all the three channels (except for isoluminant cases, where further investigation is needed).
Consequently, the RadGrad model, supplemented by the principle of separate processing on RGB channels, is an adequate theoretical model for the Hermann-grid phenomena.
. . . > > > Abstract in Perception
Detailed presentation
1. split the coloured Hermann grid into R, G and B channels;
2. run the RadGrad simulation, separately on the R, G and B channels;
3. rejoin the R,G,B channels into coloured image.
1. In case of a red and white Hermann grid (for example):
(A) (B) (C) (D)
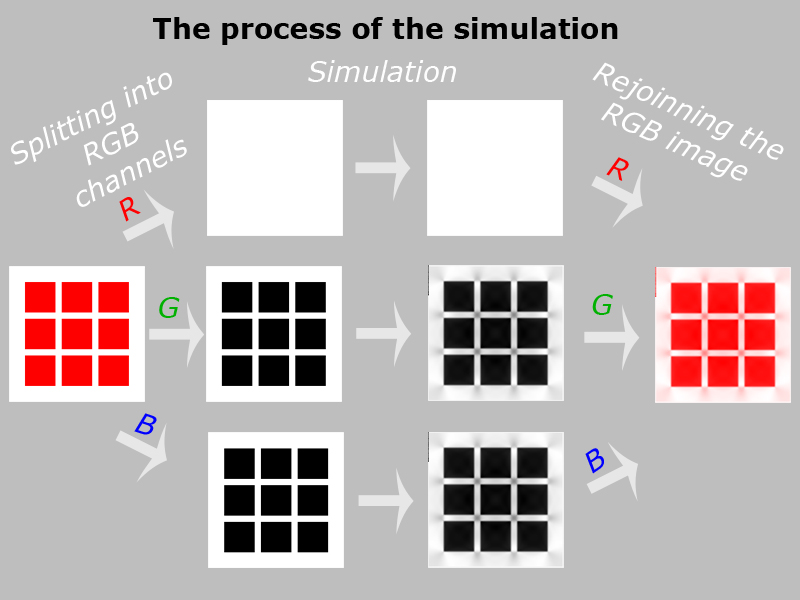
Simulation example in case of a red "houses" and white "streets" Hermann grid:
(A): the original coloured grid;
(B): splitting into R,G,B channels (gray values represents the intensity of the given channel);
(C): results of "RadGrad" simulation (spots are the results of the simulation - they are not illusory!:);
(D): rejoinning the R,G,B channels into coloured image.
>>> See more simulation output pictures
If (for example) a red and white Hermann grid is split into R, G and B channels, there will be no grid on the R channel. It is because both white and red equally contains red light, since white is the additive mixture of red, green and blue. On the other hand, the squares will be black on B and G channels, since the red squares contain no red light, so the light intensity of the squares will be minimal in these two channels. When the simulation is run on these three images, the intersections will relatively darken on the B and G channels, but nothing will happen on the R channel, as there are no edges from which the activation spreading could start. Therefore, the light intensity in the intersections will be the highest on the Red channel, resulting in reddish spots.
At different "house"/"street" colour constellation, the concept is similar.
2. In case of a red and black Hermann-grid:
(A) (B) (C) (D)
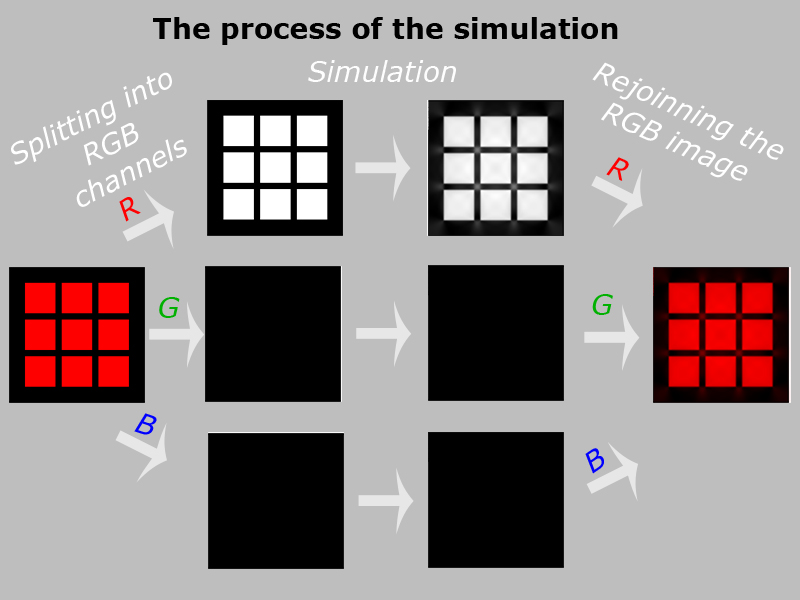
Simulation example in case of a red "houses" and black "streets" Hermann-grid:
(A): the original coloured grid;
(B): splitting into R,G,B channels (gray values represents the intensity of the given channel);
(C): results of "RadGrad" simulation (spots are the results of the simulation - they are not illusory!:);
(D): rejoinning the R,G,B channel into coloured image.
>>> See more simulation output pictures
If (for example) a red and black Hermann grid is split into R, G and B channels, there will be a grid only on the R channel. It is because black streets contain no red, green or blue, so streets will be black in all channels. On the other hand, the red squares contain maximal intensity of red light, so they will be very light on the Red channels. However, on the green and blue channels no grids will be present, since the red squares, that contain no green, nor blue light, will be as dark as the streets themselves. And as there are no edges on G and B channels, the the activity spreading will only influence the red channels: the intersections will ligthen relative to the streets. Therefore, the red channels will be the lightest among the three channels on the rejoinned output.
This principle can be applied to any colour combinations. There will be spots of definite colour in the intersections of the simulation outputs of any arbitrarily coloured Hermann-grids.
Even if the street color is white or black, the prediceted colour of the illusory spots are the same.
At arbitrary "house"/"street" constellation, we can predict the perceived colours of the spots by the same concept.
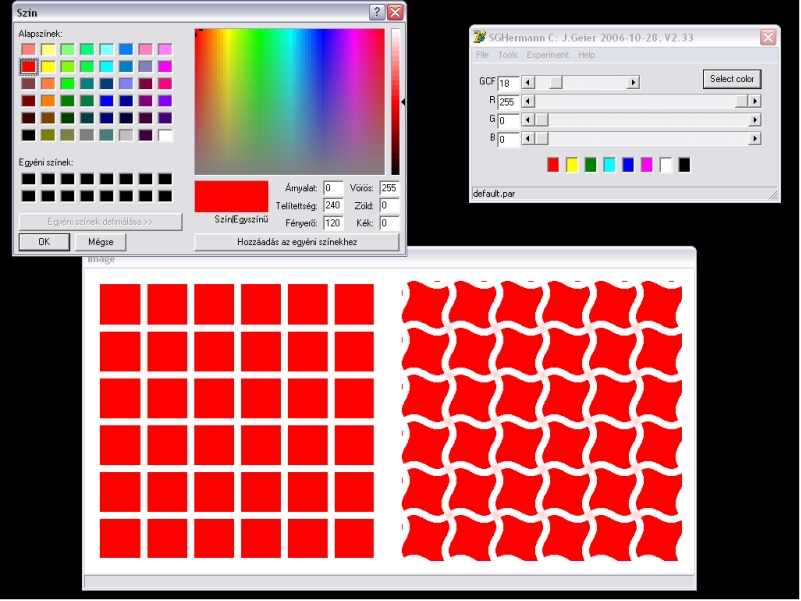
The screen of the experiment program
The experiment (with 31 subjects)
This figure shows an example of the screen of our experiment progam. >>>See more examples from the experiment
On the lefthand-side of the black computer screen, subjects were shown a chromatic Hermann grid with illusory spots. (various colour-combinations were used, including complementer and isoluminant colour-pairs). On the righthand-side, a Sinusoid grid of the same colour-pair was shown, with program generated spots. (illusory spots are not visible at sinusoid grid, as it is well known, see Geier et al 2004)
In the intersections of the Sinusoid grid, the experimental computer program generates real spots. The colour of these real spots had to be adjusted by the subjects until real spots were the same colour and intensity as the illusory spots in the Hermann-grid.
The subjects could use any colour from the Windows colour-palette, and they also could adjust the intensity/transparency of the chosen colour.
By using the Sinusoid grid as the environment of the real spots, we aimed at providing an environment similar to that of the illusory spots, in order to avoid influence of different environment on colour perception.
The program stored the RGB codes of the colours set by the subject, so that we were able to compare them statistically with the simulation of the RadGrad modell.
These diagrams display the R, G and B values of the colours that were set by the subjects and by the RadGrad simulation.
Magenta lines ( --o--) sign the model-predicted values; Blue lines ( --o--) sign the averages of the subjects in experiment.
On the X axis, the abbreviations of the image names are displayed.
Abbreviations:
the first letter stands for the colour of the houses,
the second letter stands for the colour of the streets, and
the third one for the given channel.
For example: RWB means: houses are Red, streets are White, and the last B means the Blue channel component of the illusory (or simulated) spots in this Red/White Hermann grid..
The initial IL means isoluminant. (R=red, G=green, B=blue, W=white, K=black, C=cyan, M=magenta, Y=yellow).
The correlation between the R, G and B values of subjects and of the simulation is >0.9 in all the three cases. Consequently, the RadGrad model gives an apt prediction of the perceived colour of the illusory spots in chromatic Hermann-grids.
You can see the curves of the predicted vs. perceived colours go very closely together, at R, G and B channels respectively.
Consequence:
The RadGrad model gives an apt prediction for the colour of the spots perceived in chromatic Hermann-grids.
References
Geier J, Séra
L, and Bernáth
L, 2004 "Stopping the Hermann grid illusion by simple sine distortion"
Perception 33,
ECVP2004 Supplement, 53
Geier J, Bernáth L, Hudák M, and Séra L, 2006 "Straightness as the main factor of the Hermann grid illusion" Perception, in press
Schiller P H, Carvey C E, 2005 „The Hermann grid illusion revisited” Perception, 2005, 34 (11), 1375-1397
(since April 14, 2007)
(since Dec
13, 2007)
Last modified: 2009-10-12 16:45 +0200